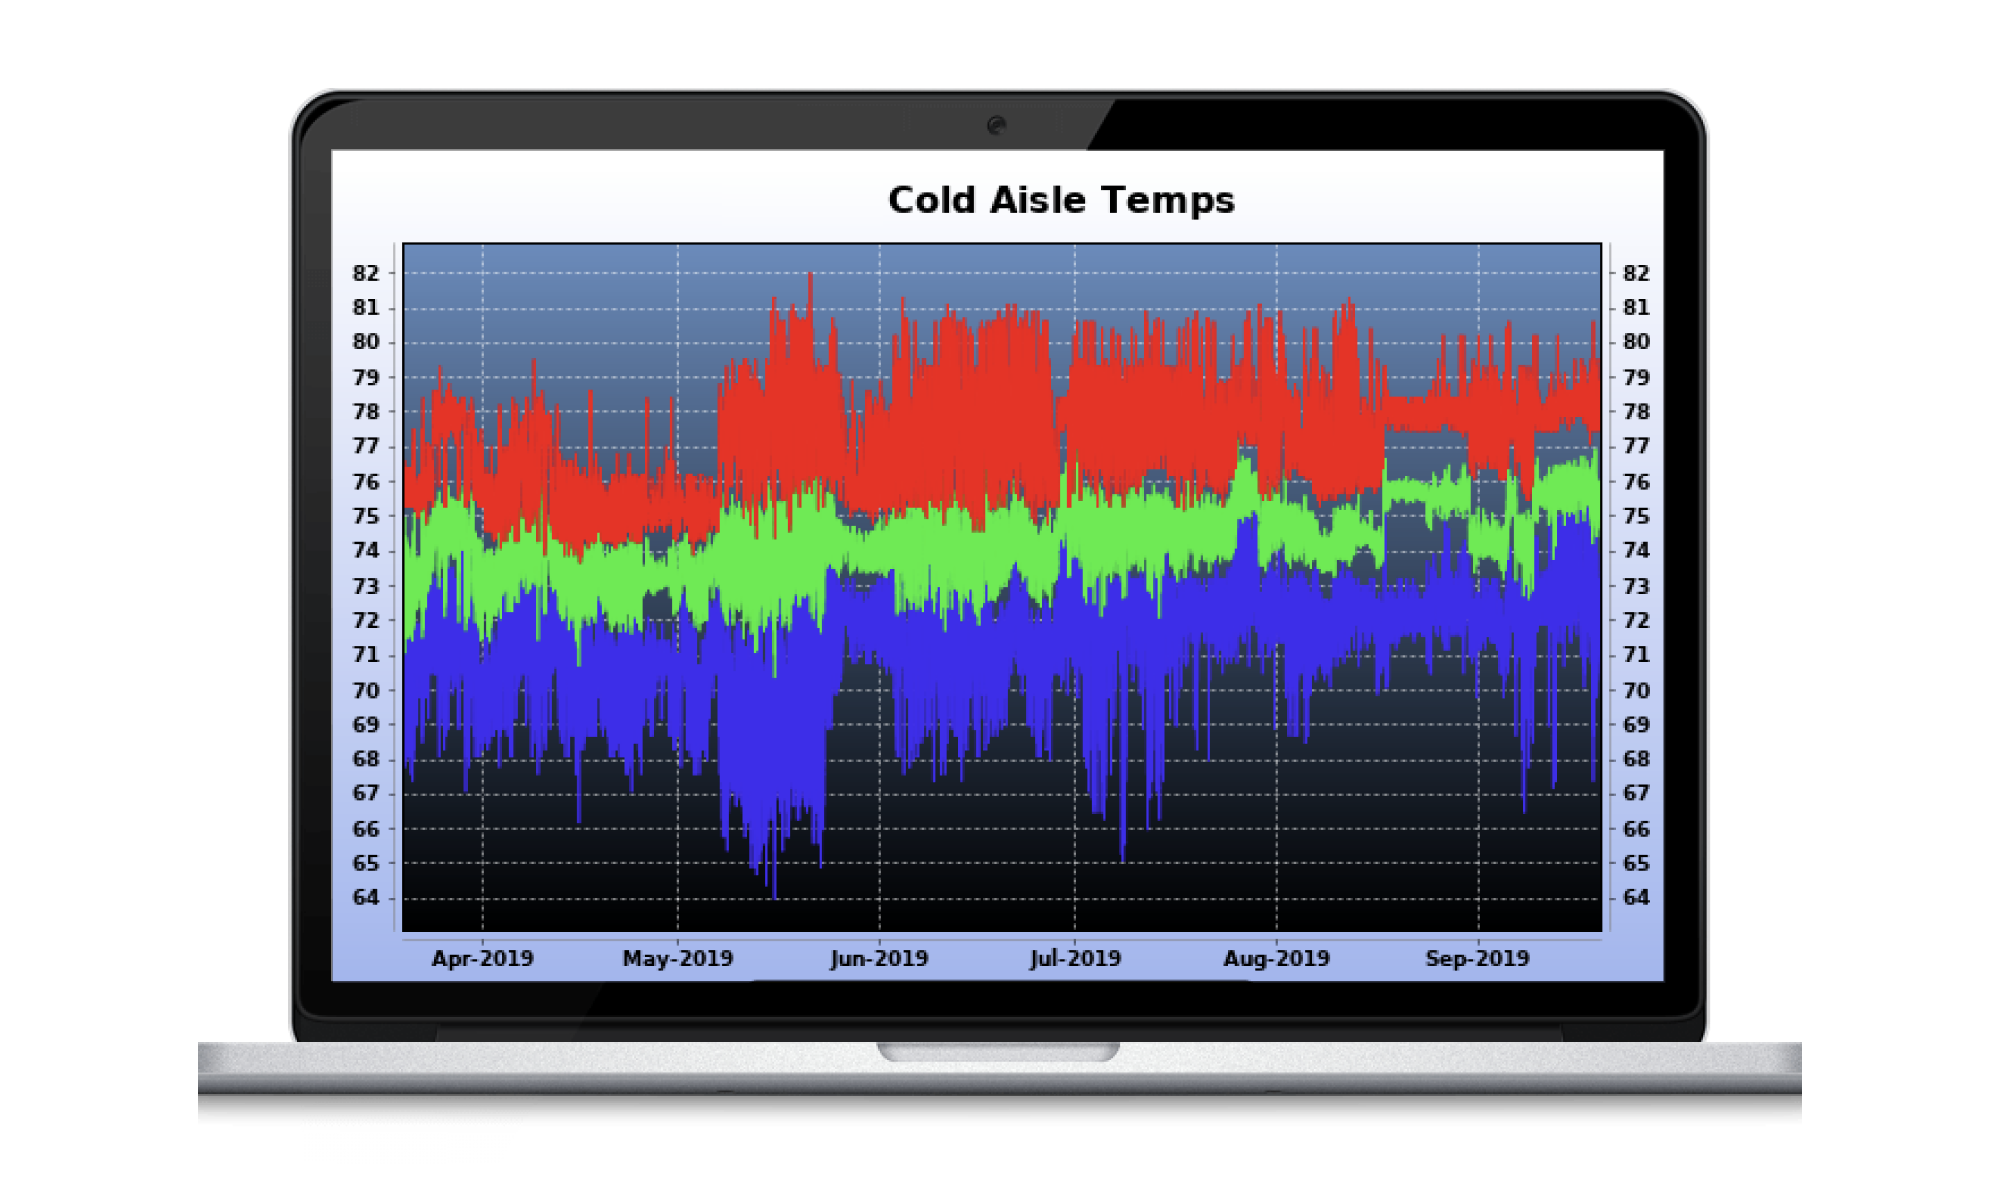

See the Pulse of your Environments
- Recognize temperature and power use anomalies to reduce risk
- Compare established thresholds to actual utilization to understand available capacity or stranded power
- Forecast future consumption trends for planning
- Ensure performance and response time is acceptable
- Enable NOC teams with custom visibility to DC status

How We Do It:
- Graph multiple data sets and types in single view
- Customizable look and feel
- User-defined parameters and timeframe
- Poll scripted data points for application or network performance views
